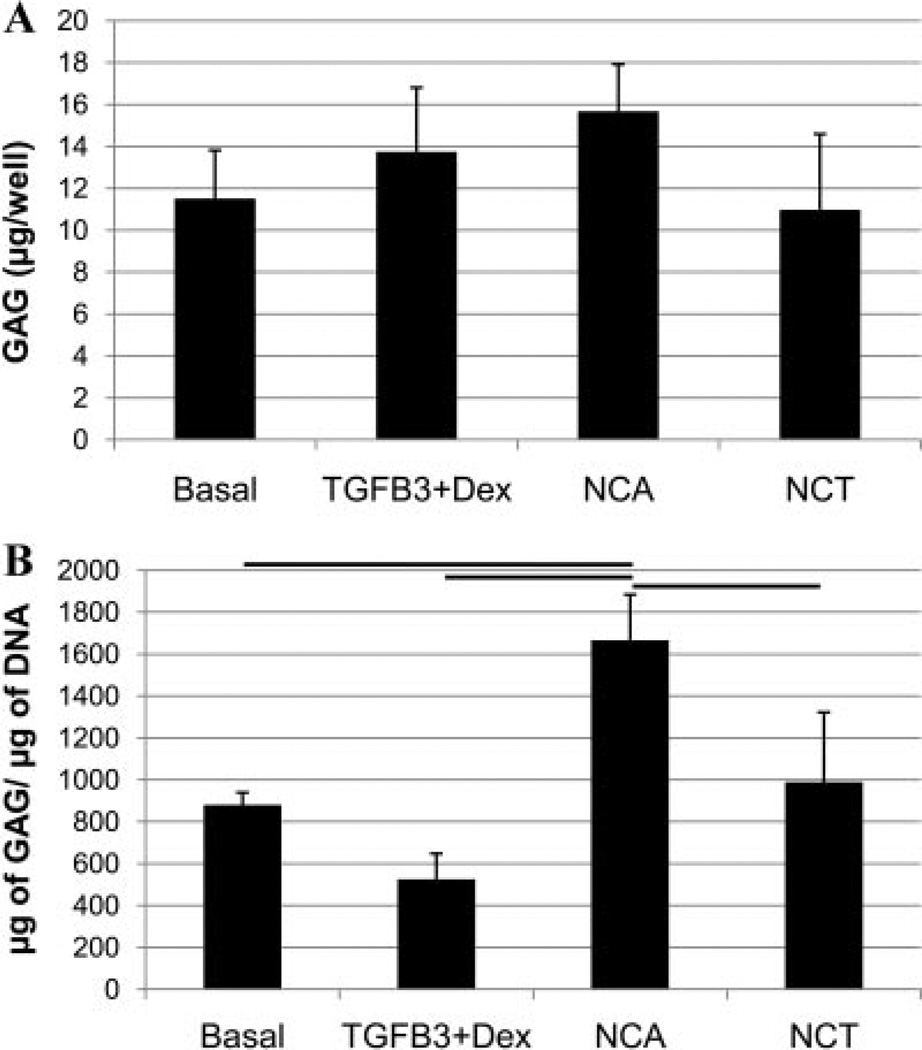
Figure 3.
DMMB analysis was used to assess the amount of GAG in the alginate constructs. Overall there were no significant changes between groups per well (A); however, there was significantly more GAG per cell (B) with the NCA treatment compared to the other groups. Lines indicate significance of p < 0.05, and error bars are SEMs.

