
Fig. 1.
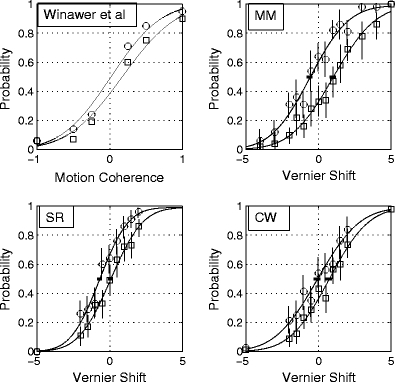
The first panel (top left) shows data from Winawer et al. (2010). The vertical axis shows the probability of classifying the motion direction left versus right. The remaining panels show psychometric functions from a three-dot vernier alignment task, in which the magnitude of the physical shift of the centre dot (horizontal axis) was sampled from a set of fixed values without replacement. The units of displacement are Weber fractions as percentages (100 * target shift/interpatch distance). Negative shifts are shifts “down.” The vertical axis is the probability with which the observer classifies a shift as “up” versus “down.” Vertical bars are 95% confidence limits based on the binomial distribution. The circles show data taken with the observers’ natural biases; the rectangles with a deliberately feigned bias in the opposite direction. All curves are best-fitting two-parameter (μ, σ) cumulative Gaussian functions. The small horizontal bars at .5 on the ordinate show the 95% confidence intervals for the mean of the psychometric function μ, obtained from 160 simulated runs of the experiment using the maximum-likelihood fits of μ and σ