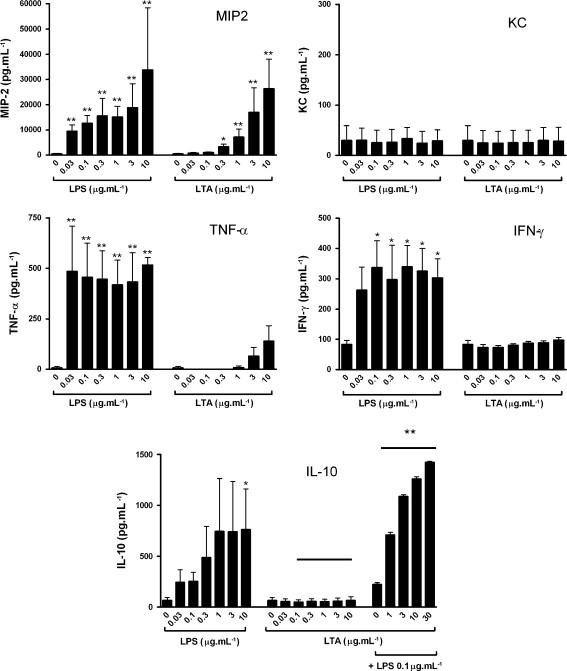
Fig. 2.
LTA and LPS cause different profiles of cytokine/chemokine release in J774 cells. Concentrations of MIP, KC, TNFα, IFN-γ and IL-10 were measured in cell supernatants at 24 h following exposure to LPS (0.03–10 μg/ml) or LTA (0.03–10 μg/ml), and IL-10 after exposure to LTA (0.03–10 μg/ml) plus LPS (0.1 μg/ml). Data are presented as mean ± SEM of three separate experiments. *p < 0.05, **p < 0.01 compared with medium alone (0) and analysed by one-way ANOVA with Dunnett’s post test, or **p < 0.01 between equivalent bars in groups with a line above when analysed by two-way ANOVA

