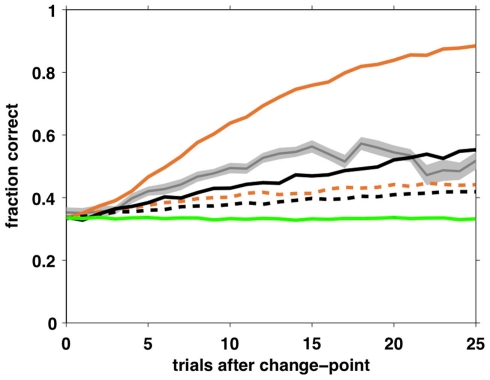
Figure 10.
Average learning curves for simulated agents performing 10,000 trials of the task with unsignaled changes. Black – full selective attention model with optimal (solid) and fit (dashed) parameters; Orange – Bayesian model with constant hazard rate with optimal (solid) and fit (dashed) parameters; Green – SA rand with fit parameter values; Gray – human data (shading: SEM).

