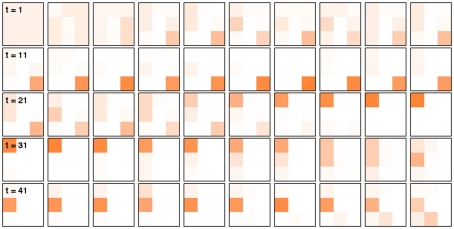
Figure 3.
Illustration of the Bayesian model in action with unsignaled change-points. Each square represents p(d, f | 𝒟1:t), the distribution over correct dimension and feature, at a different trial, starting with trial 1 in the top left and finishing with trial 50 in the bottom right corner. There are two unsignaled change-points in this data set, on trials 15 and 30. The model requires quite a few trials to detect the change (and the resulting drop from 75% chance of reward to 42%), but does so reliably.

