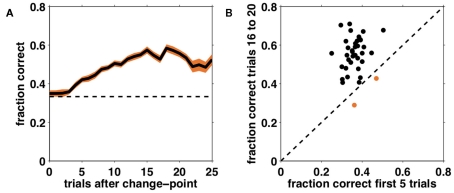
Figure 5.
Performance on the task as a function of number of trials after an unsignaled change-point. (A) Fraction correct choices as a function of trial number after a change-point, averaged across subjects (solid black line). Shading – SEM; dashed line – chance responding. (B) Comparison of average performance on trials 1–5 after a change and trials 16–20 after a change for each individual subject. The dashed black line corresponds to equality such that subjects lying above this line improved their performance over the course of a block. The two subjects that did not meet this criterion are shown in orange.

