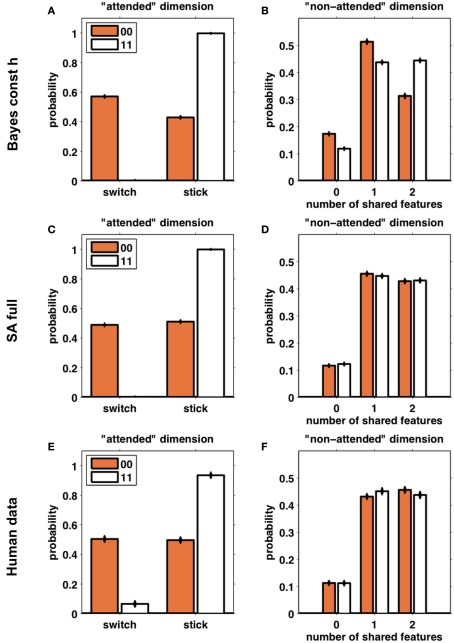
Figure 6.
Simulated data from the Bayes const h model (A,B) and SA full model (C,D) (100 “subjects” simulated for each model) compared with human behavior (E,F). Left column (A,C,E): the probability of switching away from the putatively attended dimension based on whether the outcomes for the last two trials were two losses (orange) or two wins (white). Right column (B,D,F): the number of shared features between the third choice and the second choice, in the putatively unattended dimensions, divided according to the outcomes of the last two trials (orange – two losses; white – two wins). Error bars are SEM.

