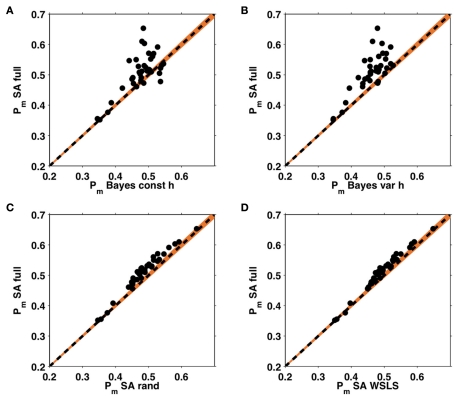
Figure 8.
Within subject analysis of average choice probabilities. ℘m values from the full selective attention model plotted against those of the four other models: the Bayesian model with constant (A) and variable (B) hazard rates, and the selective attention models with random (C) and win-stay-lose-shift (D) switching. Each dot represents an individual subject, the black dashed line indicates equality, such that the choices of any subject lying above this line are better explained by the full selective attention model. Orange shading represents a confidence interval outside which the Bayesian evidence favors one model over the other with p < 0.0001.

