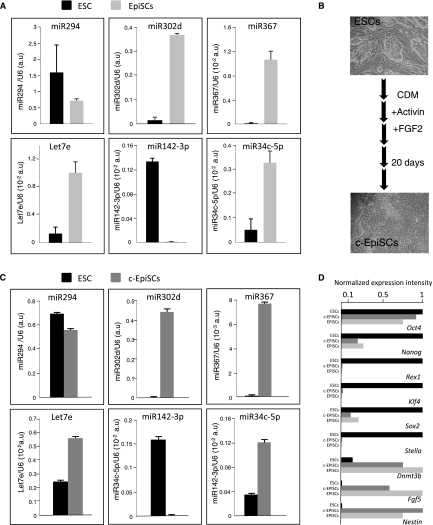
FIGURE 3.
Differential expression of miRNAs between ESC and EpiSC cell lines. (A) Expression of four miRNAs more highly expressed in EpiSCs (miR-367, -34c-5p, -302d, let7e) and two more highly expressed in ESCs (miR-294 and -142-3p) was monitored on the two ESCs and the three EpiSCs lines using real-time RT-PCR. For each miRNA, the values are normalized using U6 rRNA as reference. Error bars represent the standard error of the mean. (B) Schematic representation of the ESCs to EpiSCs conversion procedure. (C) Real time RT-PCR expression analysis of the same miRNAs before and after conversion. (D) Pluripotency and differentiation markers expression profile in ESCs, c-EpiSCs, and EpiSCs. For each marker, expression level measured by real-time RT-PCR was arbitrarily set to 1 in either ESCs, c-EpiSCs, or EpiSCs.

