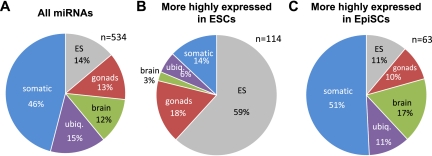
FIGURE 5.
Pie charts of miRNAs annotated according to their main trend of expression. (A) Classification of 534 miRNAs according to data published by Chiang et al. (2010). (B) Classification of miRNAs more highly expressed in ESCs (n = 114 annotated). (C) Classification of miRNAs more highly expressed in EpiSCs (n = 63 annotated). The distributions in A vs. B and B vs. C were found to be significantly different (χ2 test, P < 10−5).

