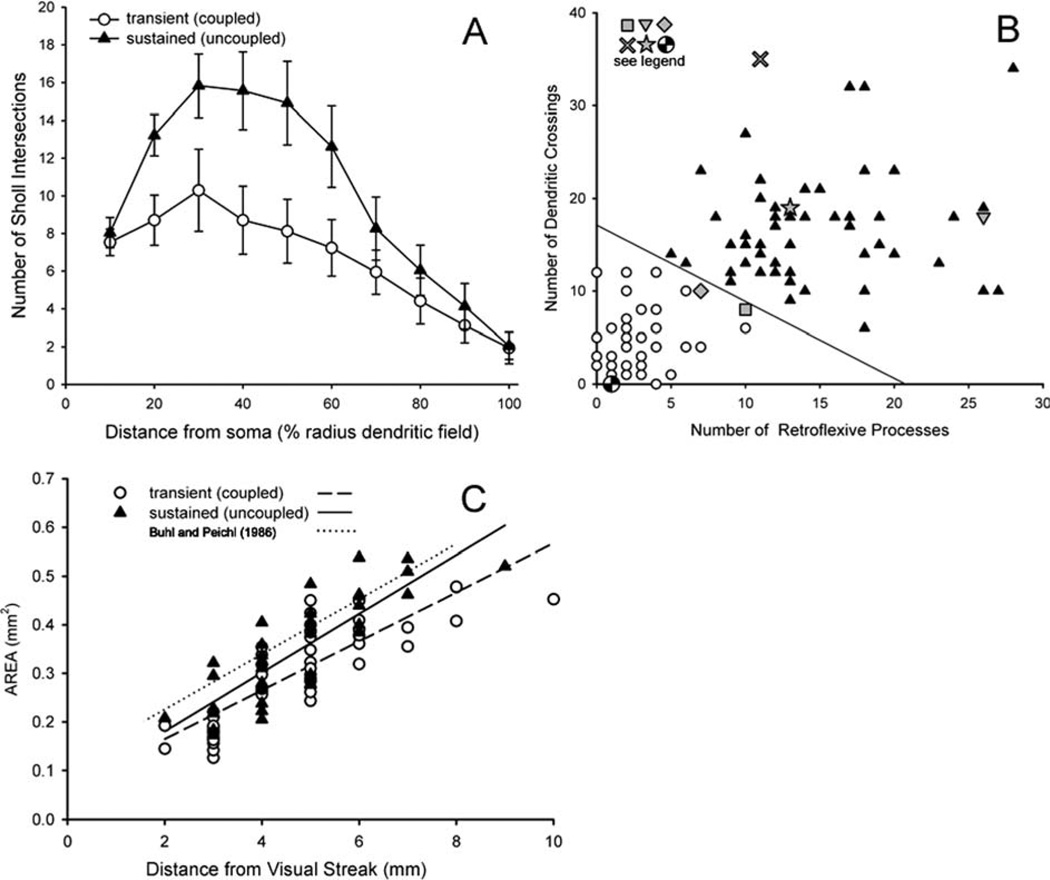
Figure 8.
Objective quantitative measurements form populations that separate the uncoupled and uncoupled ON DS ganglion cells into two groups independently of coupling. A: An automated Sholl analysis counted number of intersections of dendritic processes with the perimeters of concentric circles placed at 10-µm intervals from the soma. The distances were normalized by the radius of the cell to facilitate comparison across eccentricities. The density of uncoupled ON DS ganglion cell dendrites was much higher than that of coupled ON DS ganglion cell dendrites. Error bars = ± 1 SE. B: A plot of the number of retroflexive processes vs. the number of times a cell’s dendrites cross one another fully separates the populations (unfilled circles: transient coupled ON DS ganglion cell; filled triangles: uncoupled sustained ON DS ganglion cell). Six cells whose dendritic morphology has been previously published were analyzed in parallel. These are: checkered circle (Pu and Amthor, 1990; fig. 7L); square (Buhl and Peichl, 1986; fig. 10, third from top); diamond (Ackert et al., 2006; fig. 1E2); star (Pu and Amthor, 1990; fig. 7F); X (Kanhjan and Vaney, 2008); inverted triangle (Buhl and Peichl, 1986; fig. 10, bottom). C: The dendritic field area increases for each cell in the ventral retina as a function of distance from the visual streak. The lines are linear least squares fits to each data set as labeled. The size differences are not significant.

