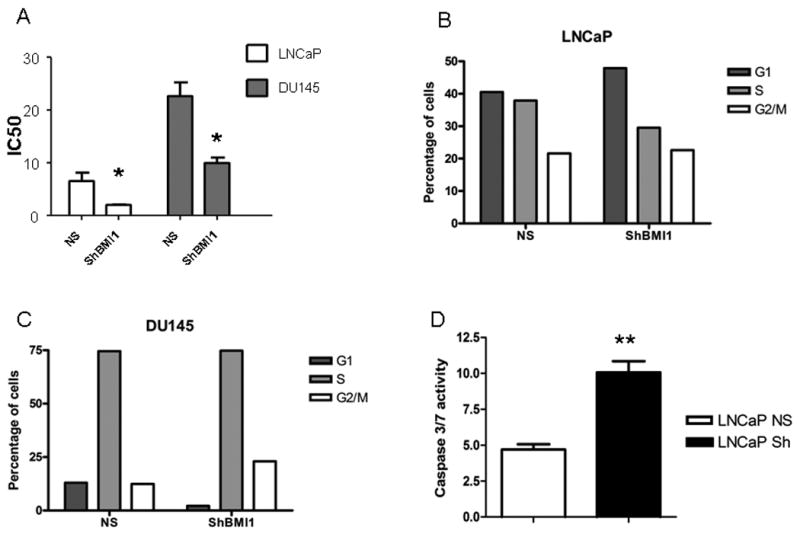
Figure 2. Effects of BMI1 silencing on Docetaxel activity.

A: IC50 of cells treated at different Docetaxel concentrations * p<0.05, T test. B, C: cell cycle distribution of Docetaxel-treated cells. D: Caspase 3/7 activity in LNCaP cells treated with Docetaxel at IC50 concentration for NS cells ** p<0.01, T test.
