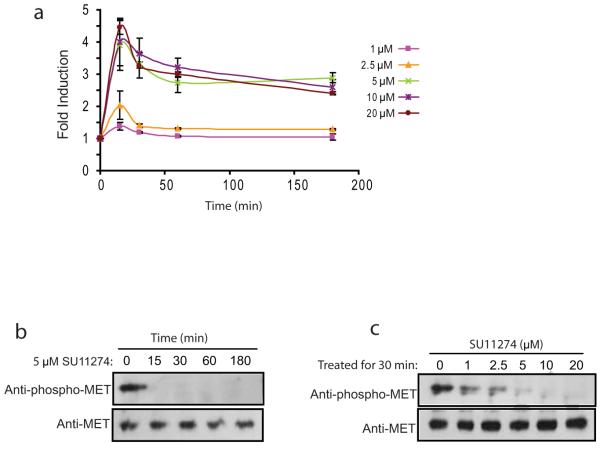
Figure 2. Imaging of c-Met activity.
a. U87-BMRwt cells treated with various doses (1, 2.5, 5, 10, and 20 μM) of SU11274 were imaged at different times (5, 15, 30, 60 min). The changes in bioluminescence activity were plotted as fold induction over pretreatment values. Data were derived from a minimum of five independent experiments.
b. Western blotting analysis of samples treated with 5 μM SU11274 at various times from a was conducted using antibodies specific for phospho-c-Met or total c-Met.
c. Cells treated with SU11274 at various concentrations for 30 min were collected and lysed for western blotting analysis using antibodies specific for phospho-c-Met or total c-Met.

