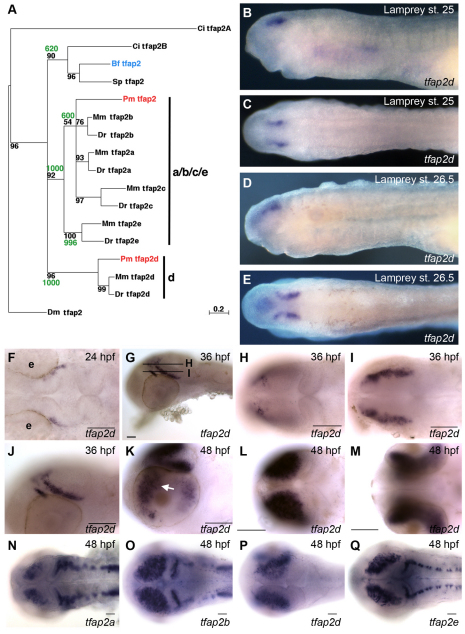
Fig. 1.
Characterization of embryonic tfap2d expression in zebrafish and lamprey. (A) Phylogenetic tree of deuterostome and Drosophila melanogaster tfap2 genes, constructed using the Maximum Likelihood method (Schmidt et al., 2002). A similar tree topology was obtained using the Neighbor-Joining method (not shown) (Saitou and Nei, 1987). Confidence values for both methods are shown at branch points with quartet-puzzling reliability scores in black and Neighbor-Joining bootstrap values in green. Each gene name includes a prefix with the initials of the corresponding species name. Ci, Ciona intestinalis; Pm, Petromyzon marinus; Mm, Mus musculus; Dr, Danio rerio; Bf, Branchiostoma floridae; Sp, Strongylocentrotus purpuratus; Dm, Drosophila melanogaster. (B-E) Lamprey embryos, fixed at the stage indicated and processed to reveal tfap2d expression. (B,C) Expression of tfap2d is first observed in bilateral spots in the presumed forebrain after neurulation (Tahara st. 25) in lateral (B) and dorsal (C) views. (D,E) Expression in the brain at late larval stage (st. 26.5) in (D) lateral and (E) dorsal views. (F-Q) Wild-type zebrafish embryos, fixed at the stages indicated and processed to reveal expression of tfap2d (F-M) or the indicated tfap2 family member (N-Q) by RNA in situ hybridization. (F) Dorsal view of the head showing tfap2d expression in a distinct structure within the presumptive mesencephalon. (G) Lateral view showing tfap2d expression within two distinct domains of the tegmentum; lines represent field of view for optical sections shown in H and I. (H,I) Dorsal views of the head, expression is in presumed tegmentum. (J) Higher magnification of embryo shown in G. (K) Lateral view of the head of a 48 hpf embryo, showing expression in tegmentum and optic tectum and retina (arrow). (L,M) Dorsal (L) and ventral (M) views of embryo shown in K, focusing on tfap2d expression within the optic tectum and retina, respectively. (N-Q) Embryos at 48 hpf, revealing shared and distinct expression domains of tfap2 family members in the brain. Embryos shown with anterior to the left, unless otherwise indicated. e, eye. Scale bars: 50 μm.

