Fig. 5.
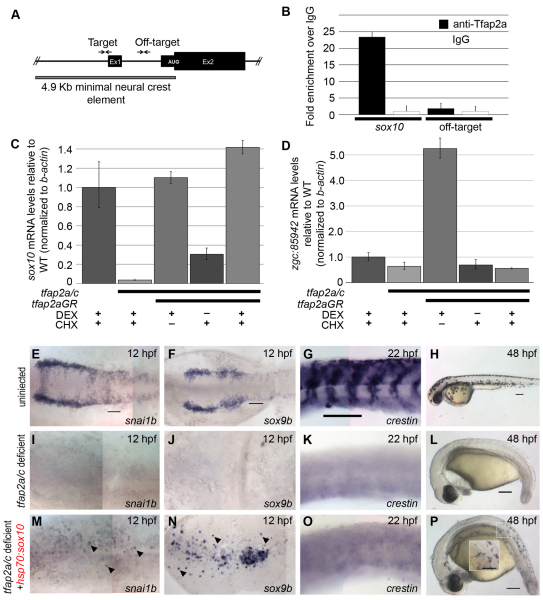
sox10 is directly regulated by Tfap2a in zebrafish embryos, and forced expression of sox10 can restore melanophores in tfap2a/c-deficient embryos. (A) Schematic of sox10 upstream element sufficient to drive NC-specific expression (Wada et al., 2005). Ex1, exon 1; Ex2, exon 2. Arrows indicate primers used to quantify results of ChIP experiments. (B) Representative quantitative real-time PCR (qPCR) results from anti-Tfap2a antibody ChIP conducted on lysates of 12 hpf zebrafish embryos (mean ± s.e.m. in technical replicates from a single representative experiment). In two additional biological replicates, qPCR revealed ∼12-fold enrichment at the target site with anti-Tfap2a relative to IgG, and minimal enrichment at the off-target site (data not shown). (C,D) Representative results of qRT-PCR analysis of sox10 (C) or the ednra homolog zgc:85942 (D) mRNA expression in lysates of embryos that were uninjected or injected with MOs targeting tfap2a and tfap2c and with tfap2a-GR mRNA, as indicated, and treated with cycloheximide (CHX) to inhibit protein translation, and with dexamethasone (DEX) to trigger nuclear localization of Tfap2a-GR, as indicated. The results are shown as fold-enrichment relative to levels in uninjected embryos treated with CHX/DEX, after normalization to b-actin. These experiments were performed three times with similar results observed (graphs represent mean ± s.e.m. of one repeat). (E-P) Dorsal (E,F,I,J,M,N) or lateral (G,H,K,L,O,P) views of embryos at the times indicated stage processed with the indicated marker. Embryos are either uninjected or injected with tfap2a and tfap2c MOs (or tfap2c MO injected into tfap2a mutant; K,L,O,P) and hsp70:sox10 plasmid, as indicated. All embryos exposed to heat-shock for 60 minutes at 90% epiboly. Rescue numbers: snai1b, uninjected, 20/23; tfap2a/c-deficient, 0/10; tfap2a/c-deficient plus hsp70:sox10, 19/27; sox9b, uninjected, 24/25; tfap2a/c-deficient, 0/10; tfap2a/c-deficient plus hsp70:sox10, 26/27; crestin, uninjected, 20/20; tfap2a/c-deficient, 0/5; tfap2a/c-deficient plus hsp70:sox10, 0/17; melanophores, uninjected, 59/59; tfap2a/c-deficient, 0/21; tfap2a/c-deficient plus hsp70:sox10,22/30. Embryos shown with anterior to the left, unless otherwise indicated. Scale bars: 100 μm.

