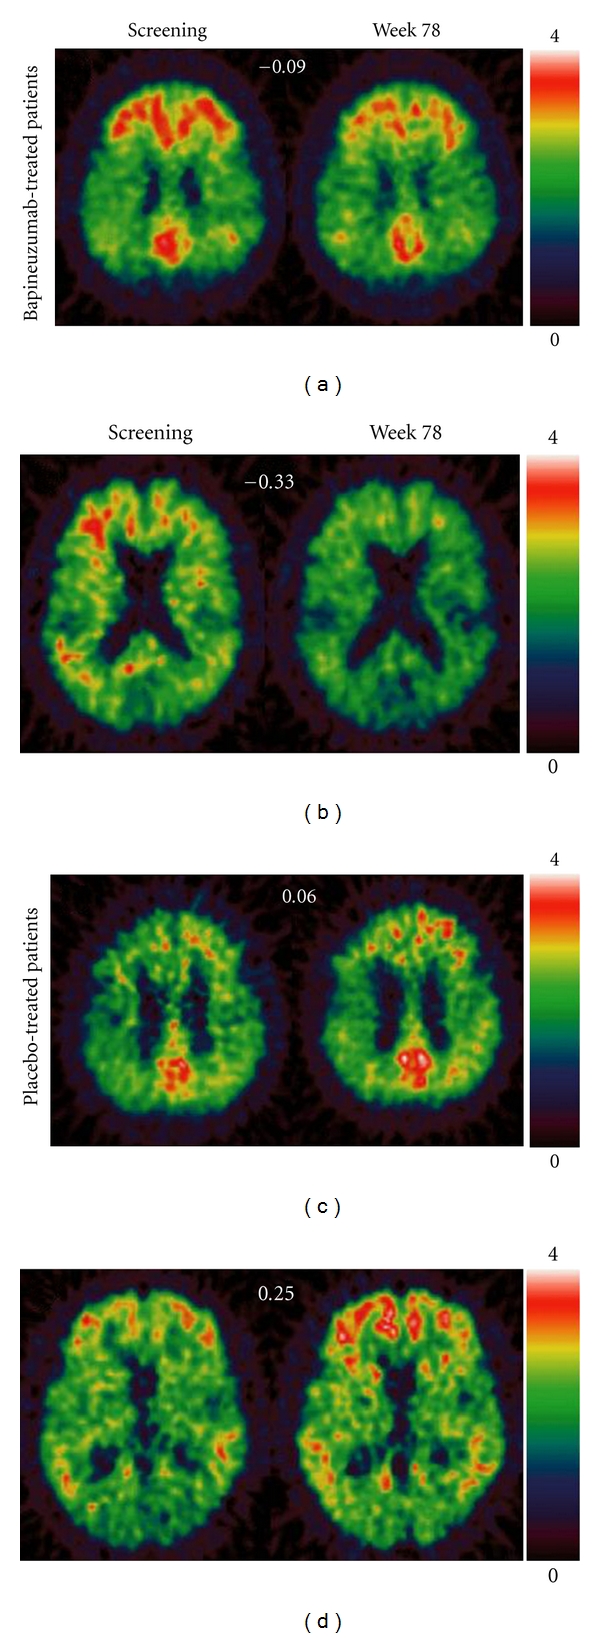
Figure 2.

Positron emission tomography (PET) carbon-11-labelled Pittsburgh compound B (11C-PiB) images from patients treated with bapineuzumab and those given placebo [57]. Reprinted from [57] with permission from Elsevier. Changes from screening to week 78 in patients treated with bapineuzumab (a, b) and in patients treated with placebo (c, d). Mean 11C-PiB PET changes are shown at the top center of each panel for each patient. The scale bar shows the PiB uptake ratios relative to cerebellum by color. The scans before and after treatment are from MRI coregistered images in the same plane.
