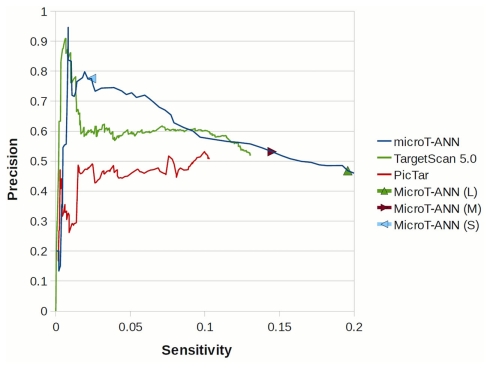
Figure 5.
Sensitivity – precision plot for DIANA-microT-ANN, PicTar, and TargetScan 5.0 predictions on the HITS-CLIP dataset of Chi et al. (2009). By lowering the score cutoff, the precision of each algorithm (the fraction of the supported targets correctly predicted, averaged over all miRNAs) is shown versus the sensitivity for that cutoff. The performance of DIANA-microT-ANN at the strict, medium, and loose score cutoffs are also indicated.

