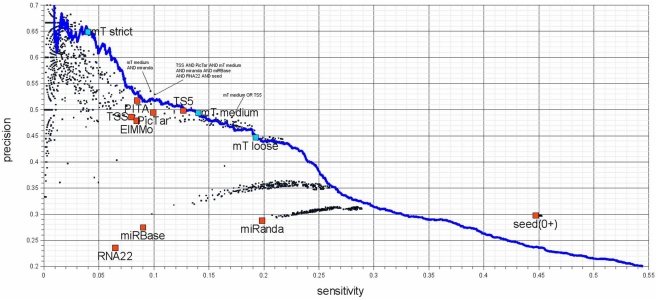
Figure 6.
Sensitivity – precision plot for 10 target-predictors (red) and all possible combinations of their predictions (black). The performance of DIANA-microT-ANN is measured at the three suggested score cutoffs (blue squares) as well as at all other score cutoffs (blue line). Union combinations contain all target genes predicted by any of the combined programs and intersection combinations contain target genes predicted commonly by all of the combined programs. The investigated programs are PicTar (Lall et al., 2006), TargetScanS (Lewis et al., 2003), TargetScan 5.0 (Friedman et al., 2009), PITA (Kertesz et al., 2007), ElMMo (Gaidatzis et al., 2007), RNA22 (Miranda et al., 2006), miRanda (John et al., 2004; obtained from mirna.org), miRBase-Targets (Enright et al., 2003; miRanda algorithm provided by microrna.sanger.ac.uk), DIANA-microT-ANN, and additionally genes containing at least a single 6 nt long miRNA seed. Seed based predictions achieve a much higher sensitivity compared to some of the programs (the two miRanda programs and RNA22), without sacrificing precision. The seed measure is a good choice for a low-precision but very sensitive prediction. The remaining target prediction programs (PicTar, TargetScan 5.0, PITA, ElMMo, and DIANA-microT-ANN) achieve precision and sensitivity values of a similar range among them. It should be mentioned that although TargetScan 5.0 and DIANA-microT-ANN are very recent programs, PicTar is performing comparable using the same algorithm over the last few years. Their online predictions have not been updated regarding the number of new miRNAs reported in miRBase. Interesting combinations are marked in the figure and an exhaustive list of all combinations can be found in Table S1 in Supplementary Material.

