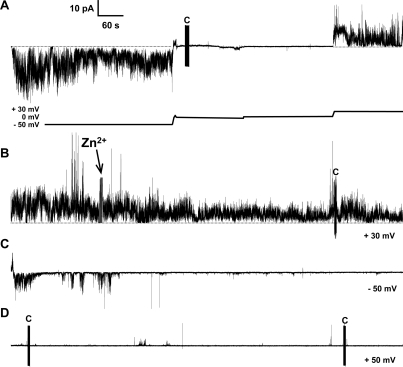
Figure 3.
Current vs time trace of channel-like activity of Aβ1–42 F20C. Channels formed by F20C predominantly exhibited spiky and bursting activity. The Aβ1–42 F20C mutant channel-like activity is inhibited by Zn2+ ions. (A) Channel-like activity of Aβ1–42 F20C shows large sustained bursts and spikes with fast openings and closings. This panel shows changes in voltage as indicated by the voltage plot below the current trace. Starting at −50 mV, we gradually reduced the applied potential first to −1.5 mV and then to 0 mV followed by an increase to 30 mV. (B) We added Zn2+ to a final concentration of 0.5 mM and stirred the mixture. The activity decreased gradually as shown in panels C and D. (C) We changed the voltage bias to −50 mV, and after an additional 15 min (D), we changed the applied potential to 50 mV. At this point, the channel activity is mostly inhibited with occasional events. The figure shows four continuous 15 min traces totaling 1 h of continuous recording. The vertical lines marked with C in panels A, B, and D indicate a capacitance measurement during the recording. The electrolyte contained 150 mM KCl, 10 mM Hepes (pH 7.4), and 1 mM MgCl2. The bilayer consisted of a 1:1 (w/w) DOPS/DOPE mixture. The Aβ1–42 F20C concentration was 9 μM.

