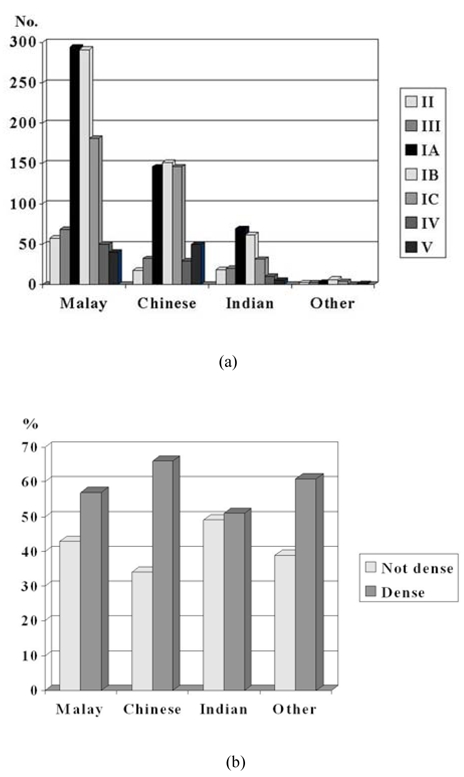
Figure 5.

a) Distribution of number of women with the various types of parenchymal patterns according to ethnicity. (The bars are arranged from left to right in order of increasing breast density i.e. Pattern II, III, IA, IB, IC, IV, and V); b) percentage of women with non-dense and dense mammograms according to race.
