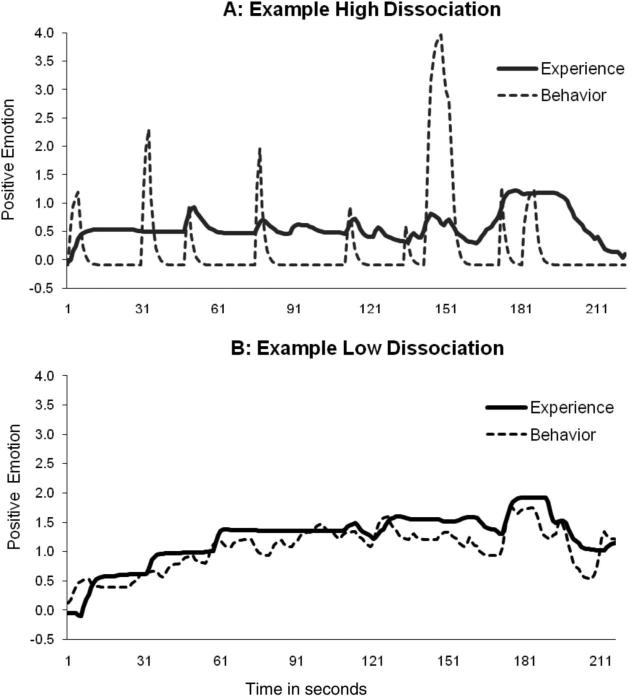
Figure 2.
Second-by-second plots for z-scored emotion experience and behavior (greater values represent more positive emotion experience and behavior) for the amusing film clip. Each panel depicts a representative participant with high dissociation (Panel A, corresponding to a dissociation index of .36) and low dissociation (Panel B, corresponding to a dissociation index of –.90).

