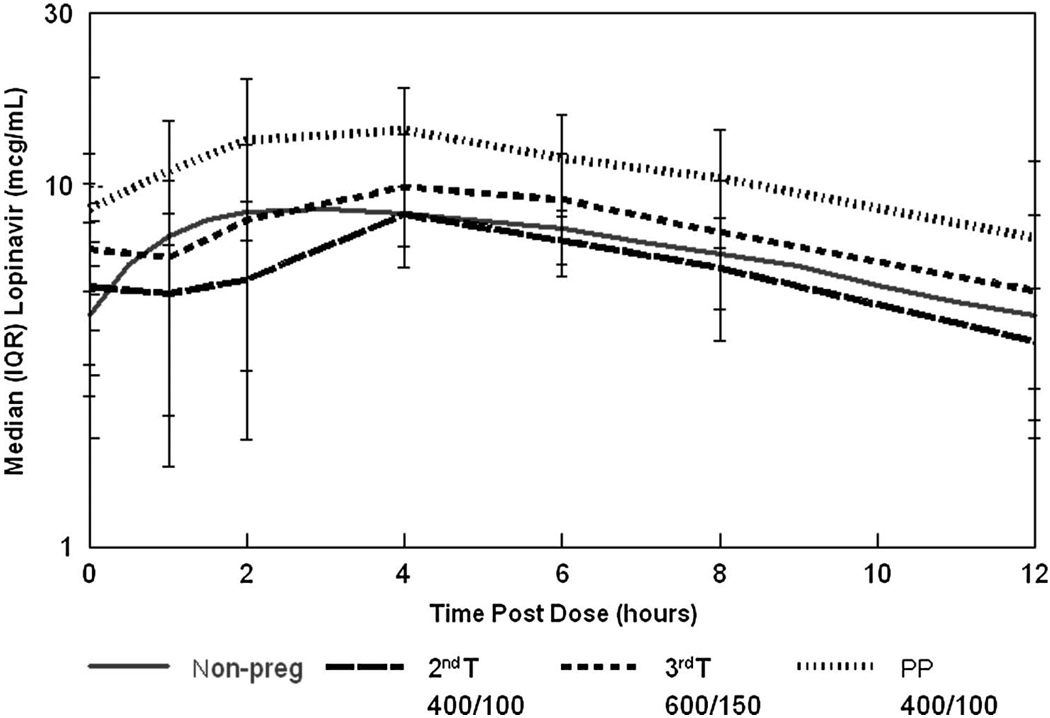
FIGURE 1.
Median lopinavir concentrations during second trimester, third trimester, and postpartum. Median lopinavir concentration–time curves ± interquartile range during the second trimester (long dashed line, n = 11), third trimester (medium dashed line, n = 33), and postpartum (fine dashed line, n = 27). The solid line represents the expected (50th percentile) concentration–time profile in nonpregnant adults.

