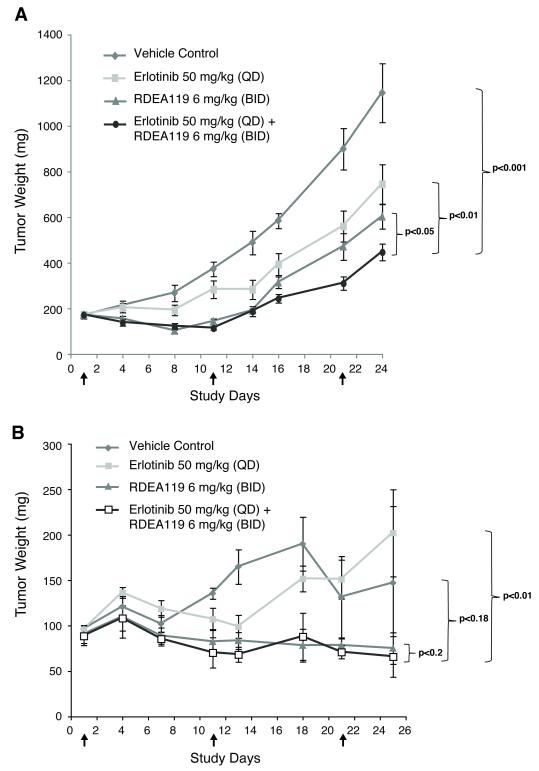
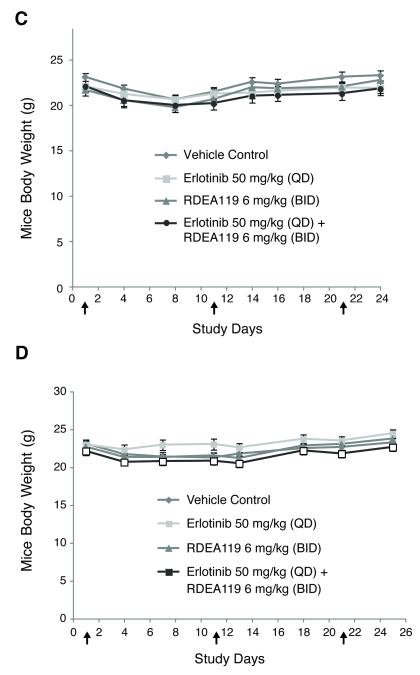
Figure 5.
Inhibition of tumor growth by erlotinib and RDEA119 as single agents or in combination in the BxPC-3 and MIA PaCa-2 xenograft model. Tumor growth curves for the different treatment groups in BxPC-3 (A) and MIA PaCa-2 (B). Mouse body weight curves for different treatment groups in BxPC-3 (C) and MIA PaCa-2 (D). Arrows indicate the treatment start and end dates.


