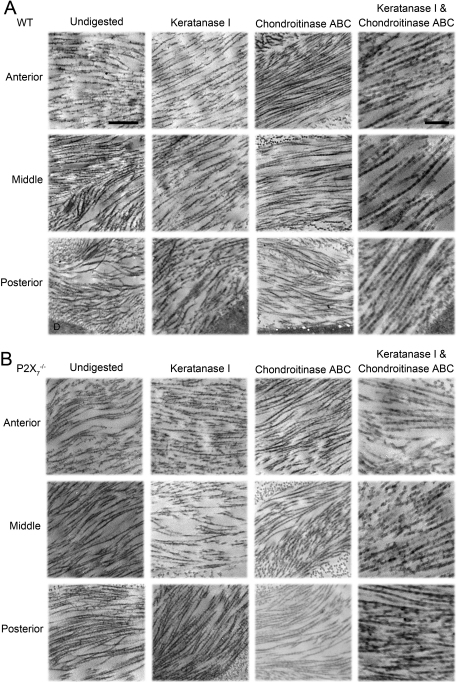
Figure 5.
Electron micrographs of electron dense filaments stained with Cuprolinic blue on stromal collagen. Samples of A: WT and B: P2X7−/− corneas were digested with either Keratanase I, Chondroitinase ABC, or both, before Cuprolinic blue staining and imaging with TEM. Undigested and stained tissue are included. The scale bar seen in the undigested column represents 500 nm, and applies to all images in the Undigested, Keratanase I, and Chondroitinase ABC columns. The scale bar seen in the Keratanase I and Chondroitinase ABC columns represent 200 nm and applies to images in that column only. Descemet’s membrane is marked with “D” and is visible in the WT posterior images.

