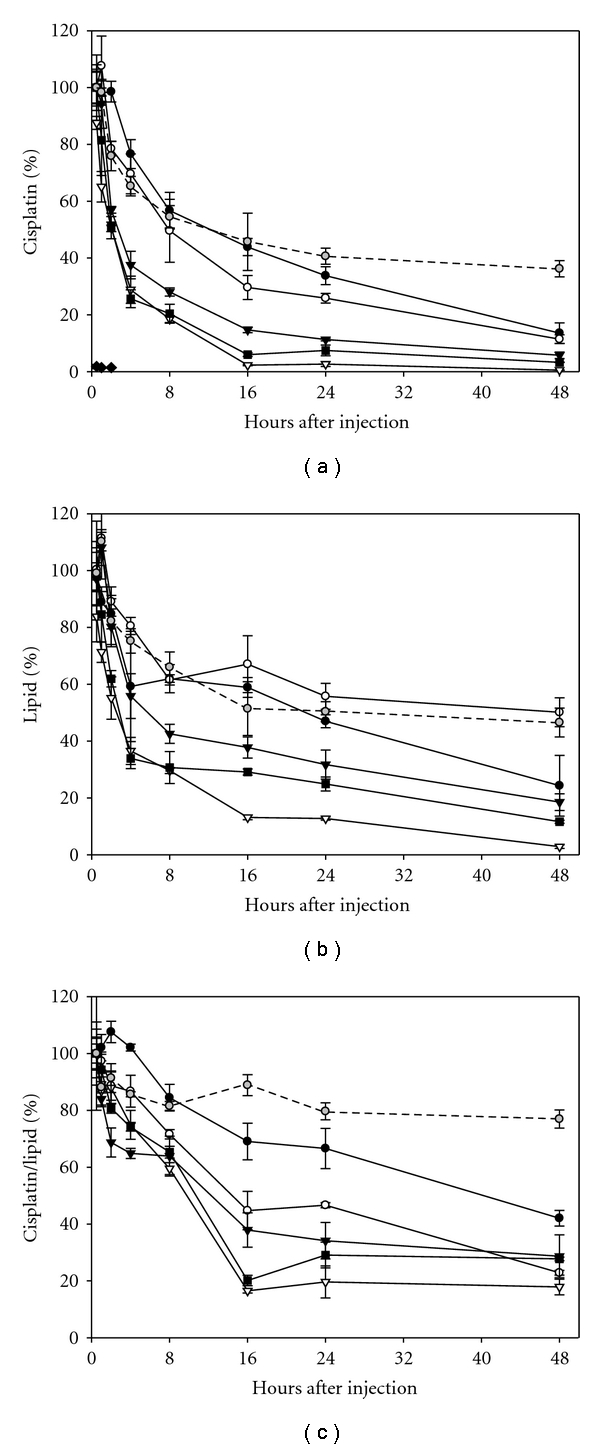
Figure 1.

Percent of injected dose for cisplatin (a), lipid (b) and percent initial cisplatin/lipid ratio (c) in plasma following i.v. administration of cisplatin containing liposomes into BDF-1 mice. The formulation compositions: DSPC : DSPG : CHOL (7 : 2 : 1) (●); DSPC : DPPC : DSPG : CHOL (6 : 1 : 2 : 1) (∘); DSPC : DPPC : DSPG : CHOL (35 : 35 : 20 : 10) (▾); DSPC : DPPC : DPPG : CHOL (35 : 35 : 20 : 10) (■), DPPC : DPPG : CHOL (7 : 2 : 1) (▿); DSPC : CHOL (55 : 45) (gray circle); and free cisplatin (♦), were all administered at a cisplatin dose of 3 mg/kg (n = 3, Mean ± SD). Mouse plasma was collected at 0.5, 1, 2, 4, 8, 16, 24, and 48 hours after administration. The platinum concentration was determined by atomic absorption spectroscopy and the lipid by scintillation counting.
