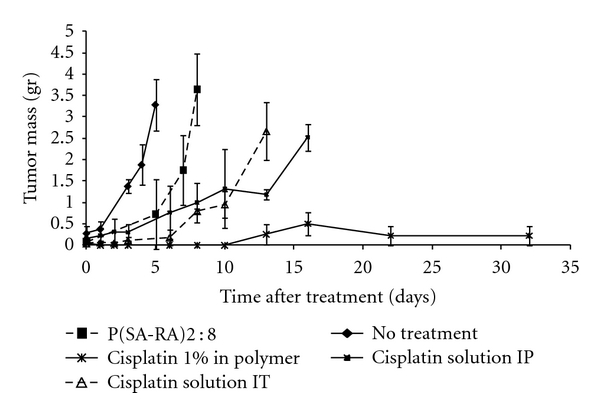
Figure 3.

Effect of cisplatin on MBT tumor growth in s.c. implanted mice (n = 10). Cisplatin 1% w/w in polymer, 50 μL (∗: solid line); blank polymer (■, dashed line); cisplatin solution (0.1% w/v in saline, 100 μL injection, 5 mg/kg) (∆, dashed line) were injected intratumorally. No treatment group is designated as (♦) with solid line, and the group treated IP with cisplatin solution (1% w/v in saline, 100 μL injection, 5 mg/kg) is designated as (■) with solid line. The tumor volume is expressed as mean ± STD. Statistically significant differences between the groups are signed with a star (P < .05, *).
