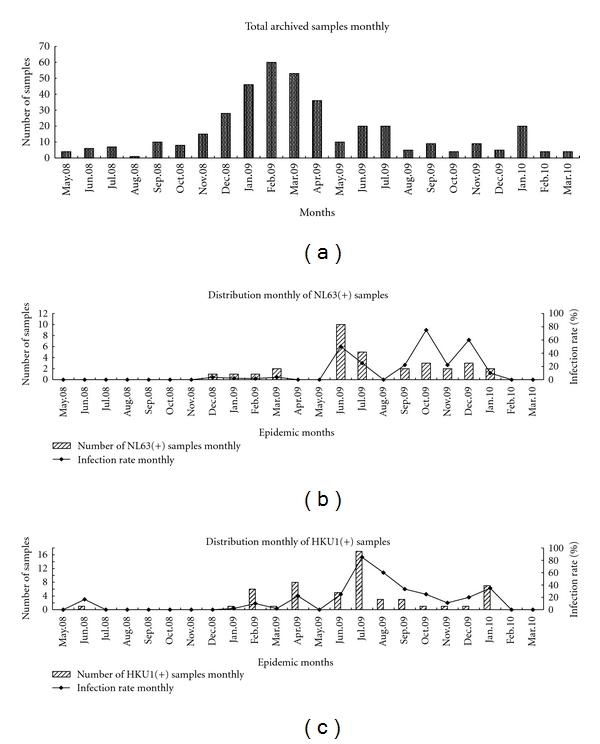
Figure 1.

Temporal distribution of HCoV-NL63 and HCoV-HKU1 infections in hospitalized children between May 2008 and March 2010. (a) the number of specimens collected from children admitted with acute respiratory infections to the Beijing Children's Hospital; (b) the number of positive specimens and percentage positive by month for HCoV-NL63; (c) the number of positive specimens and percentage positive by month for HCoV-HKU1.
