Figure 2.

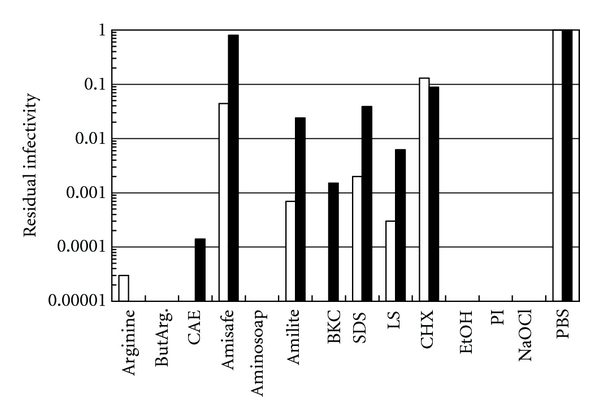
Inactivation of IAV. See the legend to Figure 1. Black and white bars represent the results in the presence or absence of 0.1% BSA.

Inactivation of IAV. See the legend to Figure 1. Black and white bars represent the results in the presence or absence of 0.1% BSA.