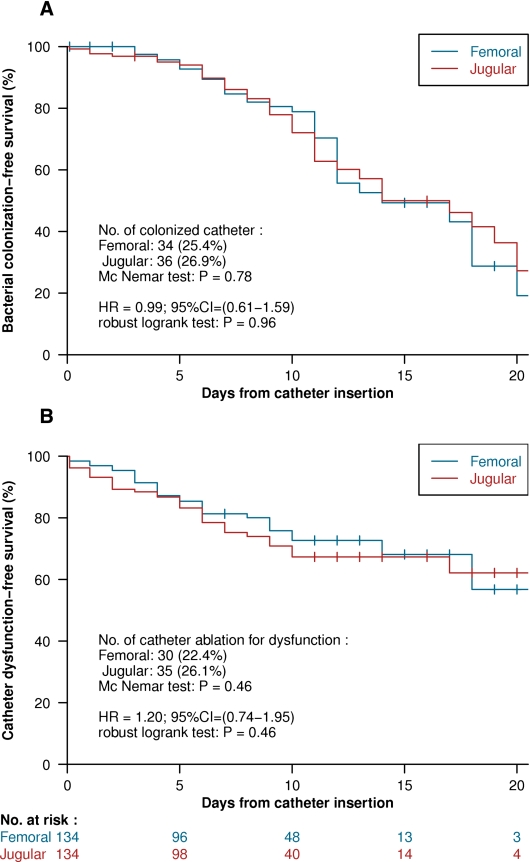
Figure 2.
Kaplan-Meier curves, comparing the two vascular access routes (femoral in blue shape and jugular in red shape), related hazard ratio, 95% confidence interval, and P value of the log rank test, using the “sandwich” robust estimator of the variance, considering the crossover design. (A) Time to catheter colonization estimation. (B) Time to dysfunction estimation.

