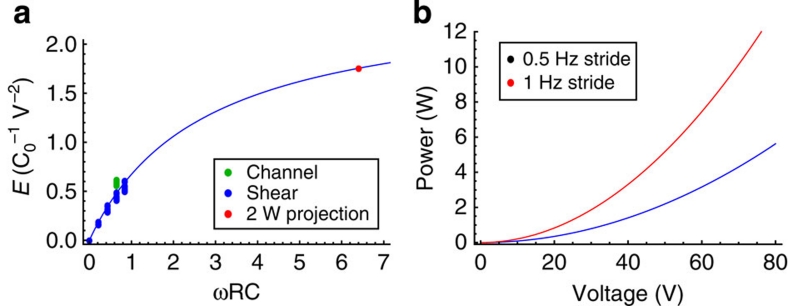
Figure 3. Plots of energy generated and predicted power.
(a) Shows energy generated per one oscillation cycle (in units of C0V2 ) as a function of dimensionless parameter ωRC0. The solid line represents equation (1). Experimental data for the droplets between sliding plates are shown in blue, and experimental data for the droplets in a channel are shown in green. The red dot represents the predicted energy for a train of 1,000 droplets. (b) Shows the predicted power for a train of 1,000 droplets as a function of the bias voltage. Calculations are for of a load impedance of 2 KΩ and a film-stack capacitance of 16 nF cm−2. The red curve corresponds to 1-Hertz stride (fast walk) and the blue curve to 0.5-Hertz stride (leisure walk).

