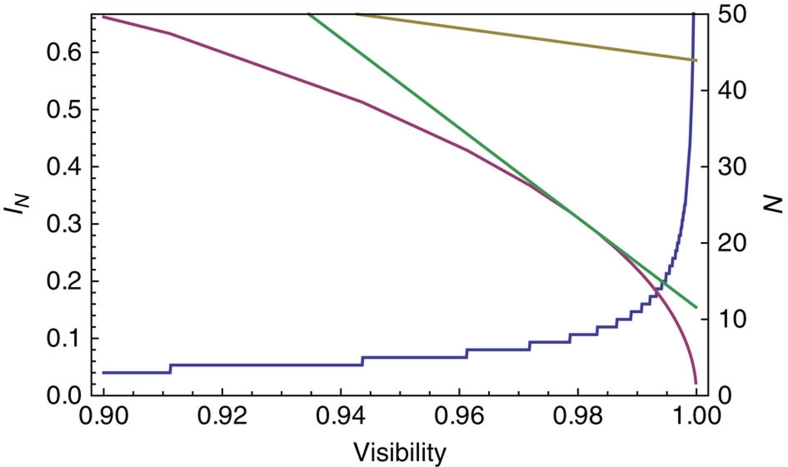
Figure 2. Achievable values of IN depending on the experimental visibility.
This figure relates to the measurement setup used for testing the accuracy of assumption QM as described in the Methods. The setup involves two parties and is parameterized by the number of possible measurement choices available to each party, N. The plot gives the minimum IN achievable depending on the visibility (red line), which determines the smallest upper bound on the variational distance from the perfect Markov chain condition (1) that could be obtained with that visibility (see equation (8)). It also shows the optimal value of N which achieves this (blue line). For comparison, the values achievable using N=2, which corresponds to the CHSH measurements26 (yellow line), and the case N=8, which is optimal for visibility 0.98 (green line), are shown.

