
Figure 11.
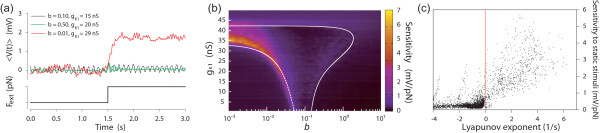
Sensitivity of the hair cell model to static stimuli. (a) Response of the membrane potential (upper panel) to a 0.5-pN step stimulus (lower panel) for values of the BK and K1 conductances as indicated. Other parameters as in Figure 7. (b) As a color plot, we show the static sensitivity as a function of the control parameters b and gK1. Static sensitivity was determined from frequency tuning curves (see Figure 10a) by averaging sensitivities in the frequency band 0.02-0.10 Hz. (c) Scatter plot of the static sensitivity versus the LE, both taken at the same values of the control parameters b and gK1. Note that the LE was determined in the absence of any external stimulus force but in the presence of noise. The vertical red line indicates where the LE is zero. AH bifurcation curves of the deterministic model are shown by white color in (b).