
Figure 2.
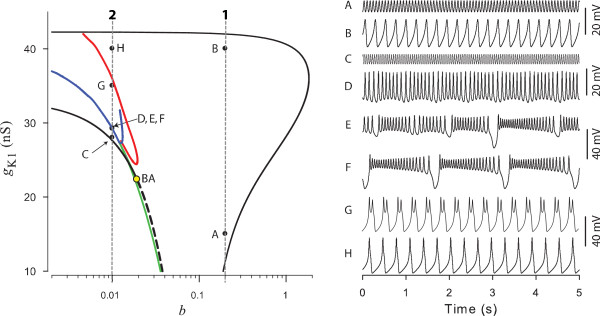
Dynamical regimes of the deterministic model (ε = 0). Left: Bifurcation diagram of the model in the (b, gK1)-parameter plane. Black solid and dashed curves correspond (resp.) to supercritical and subcritical AH bifurcations of the depolarized (left branch) and hyperpolarized (right branch) equilibrium state. Open circle indicates the Bautin bifurcation (BA). Green line corresponds to a saddle-node bifurcation of limit cycles. Blue curve indicates a torus birth bifurcation of a stable small-amplitude limit cycle. Red line indicates a period doubling bifurcation of a stable large-amplitude spiking limit cycle. Points labeled A-H correspond to the voltage traces on the right panel: b = 0.2, gK1 = 15 nS (A); b = 0.2, gK1 = 40 nS (B); b = 0.01, gK1 = 28 nS (C); b = 0.01, gK1 = 29.192 nS (D); b = 0.01, gK1 = 29.213 nS (E); b = 0.01, gK1 = 29.25 nS (F); b = 0.01, gK1 = 35 nS (G); b = 0.01, gK1 = 40 nS (H). Other parameters are gL = 0.174 nS, gMET = 0, gh = 2.2 nS, ε = 0.