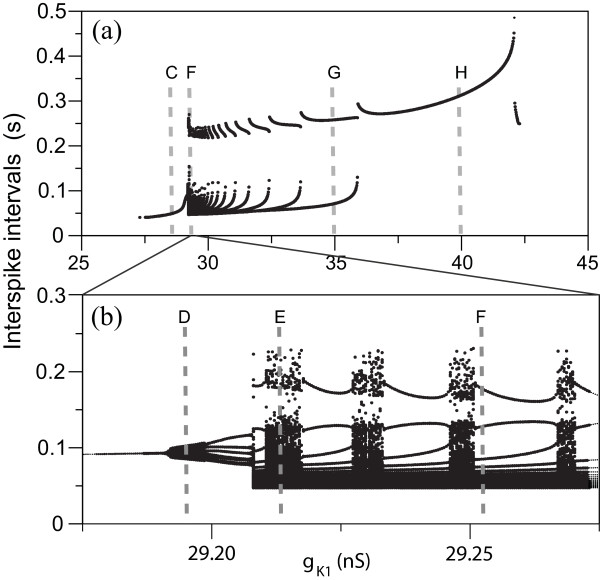
Figure 4.
Bifurcations of oscillatory dynamics in the deterministic model. (a) Bifurcation diagram of the model at b = 0.01 for the interspike intervals plotted versus gK1. (b) Zoom into the bifurcation diagram shown in panel (a). Vertical grey dashed lines labeled C-H in (a) and (b) refer to corresponding points and voltage traces in Figure 2. Other parameters are the same as in Figure 2.

