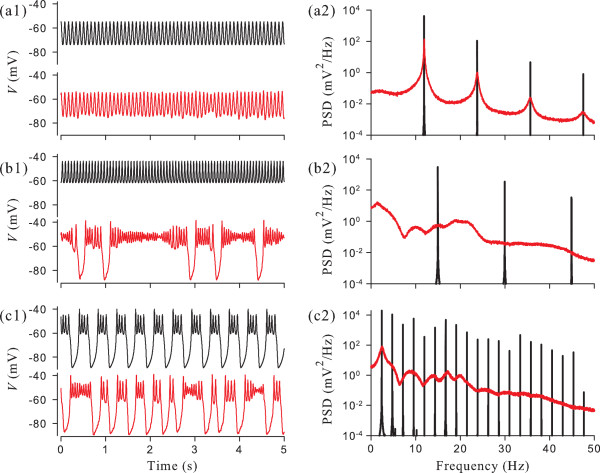
Figure 7.
Effect of thermal MET current fluctuations on spontaneous oscillations of the membrane potential. Left column: voltage traces for the deterministic model with ε = 0 (black line, upper traces) and for the stochastic model with ε = 1 (red line, lower traces). (a1): b = 0.1, gK1 = 10 nS. (b1): b = 0.01, gK1 = 29 nS. (c1): b = 0.01, gK1 = 32 nS. Right column: PSDs corresponding to the voltage traces shown in (a1), (b1), and (c1). Other parameters: gMET = 0.65 nS, gL = 0.1 nS, gCa = 1.2 nS, gh = 2.2 nS.

