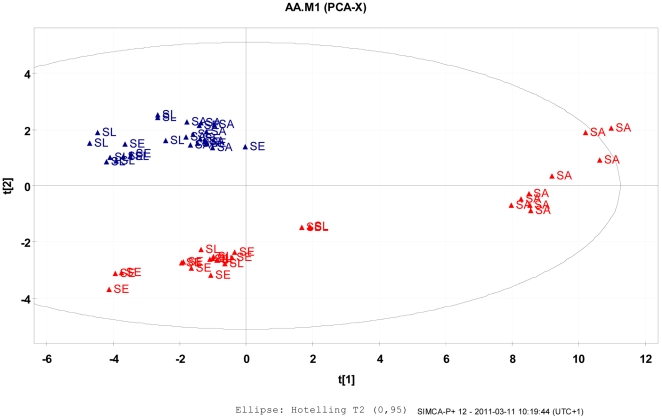
Figure 4. Principal Component Analysis (PCA) scores (t1 versus t2) scatter plotted from staphylococcal cell-wall amino acid profile data.
The staphylococci cultures were grown under ideal conditions at 37°C representing the reference control samples (Cont) or subjected to prolonged exposure to 4°C for 8 weeks (TE) before sampling and amino acid analyses. Three different strains, S. aureus (SA), S. epidermidis (SE) and S. lugdunensis (SL) were investigated in replicates (n = 9) for each strain for responses to the temperature conditions.

