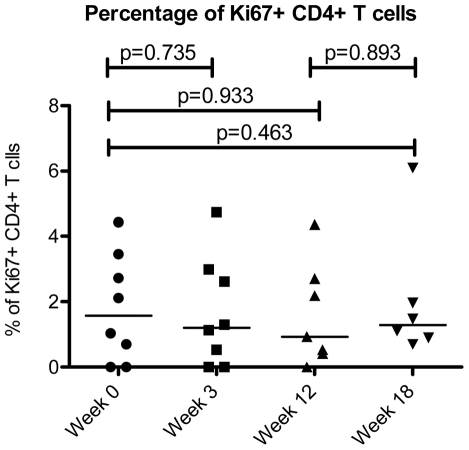
Figure 3. Cell cycle status of CD4+ T cells.
The cell cycle status of CD4+ T cells as measured by Ki-67 expression is shown over the course of interferon-alpha treatment during the ACTG 5192 Study. Week 0 corresponds to the patients' baseline cell counts before beginning Interferon-Alpha Therapy. Weeks 3 and 12 correspond to 3 weeks and 12 weeks of interferon-alpha Therapy. Interferon-Alpha therapy was stopped at Week 12, and therefore Week 18 corresponds to 6 weeks off therapy. The bar represents the median value.

