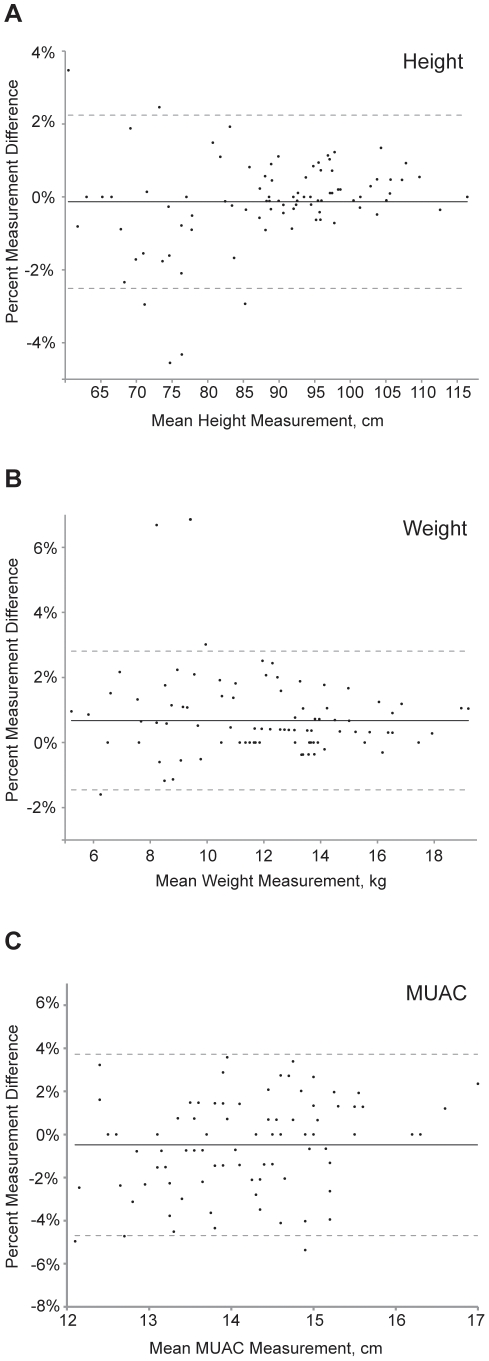
Figure 2. Bland-Altman plots depicting inter-anthropometrist agreement.
Plots shown for measurements of (A) height, (B) weight, and (C) middle upper arm circumference in 89 children aged 0–5 years in a community-based study in Ethiopia. The solid horizontal line represents the mean percent difference between the measurements, and the dashed lines represent the 95% limits of agreement.

