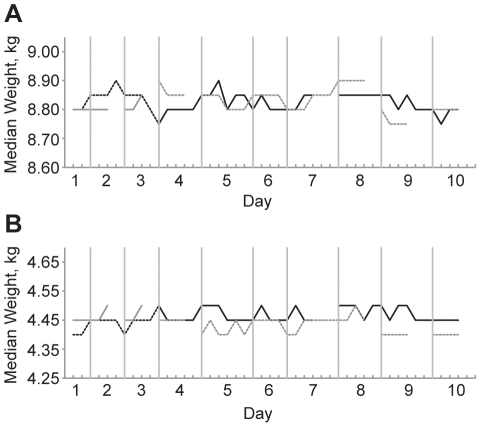
Figure 3. Reproducibility of scales in field conditions.
Graphs show (A) the 9.0 kg test weight and (B) the 4.5 kg test weight, over the 10 days of the study. The 2 different scales are depicted in black or grey, and the 2 different test weight sets are depicted as dashed or solid lines. Test weights were measured after every 10th child of the day, represented as a hash mark on the x-axis. Discontinuities in the lines indicate that the anthropometry team examined less children than the other team.

