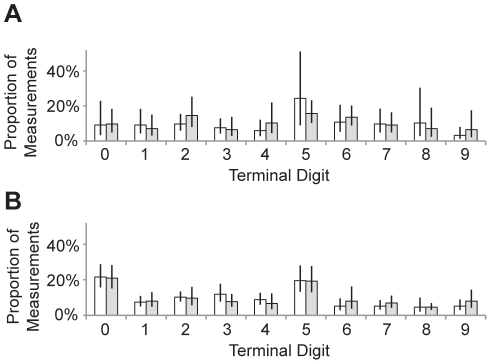
Figure 4. Terminal digit preference.
The proportion of recorded measurements with each of the 10 possible terminal digits, shown for height (white) and MUAC (grey) measurements for (A) anthropometrist 1 and (B) anthropometrist 2. Error bars represent 95% confidence intervals, accounting for the clustered study design.

