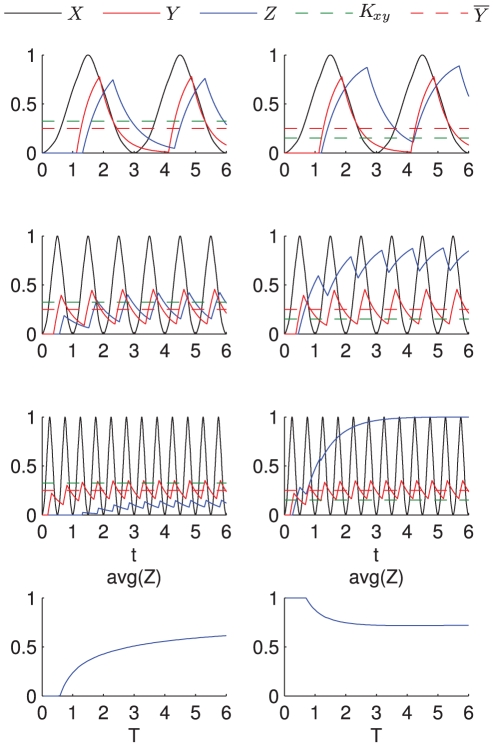
Figure 5. Two-step regulation time course dynamics varying the period of  .
.
The plots show the expression of a gene  (blue) controlled by the symmetric signal
  (black) for the two-step model. The left (right) column shows the case in which the value of
  (green dashed line) is above (below) the average value at stationary regime of the transcription factor
  (red curve). The first three rows show the time-course dynamics for
  ,
,  and
and  for three different oscillation periods, whereas the last row shows the average value of
  at stationary regime as a function of the period of oscillation of
  .
.  is turned off in the case
  as the period of oscillation decreases (left column) while it is increasingly expressed in the case
  (right column). The parameters used in the simulations are:
  ,
,  ,
,  ,
,  (this value has been chosen so that
  ) and
) and  for the left column and
  for the right column.

