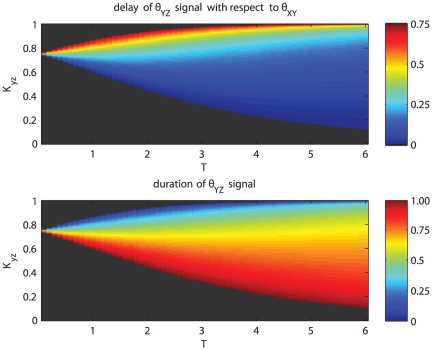
Figure 6. Y expression versus normalized time.
The top plot shows the percentage delay in  signal with respect to the
  signal, for varying period of oscillation
  and threshold value
  , the bottom plot shows the percentage duration of the
  signal. For values of the threshold
  lower than the average value of
  , decreasing the period of oscillation causes a faster response (lower delay) and a higher duration of
  (that eventually is active all the time when the period is small enough). For values of the threshold
  higher than the average value of
  ,
,  is usually delayed and of short duration, decreasing the period of oscillation causes the maximum value of
  to fall below
  leading to no activation of
  . For the plots the parameters
  ,
,  ,
,  have been used.

