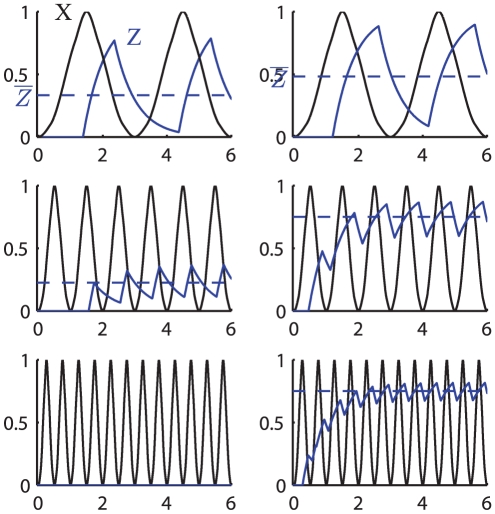
Figure 10. Time course simulation of CFFL-1.
The plots show the dynamics of  controlled by a CFFL-1 with AND gate stimulated by the symmetric signal
  with varying period when
  . The left column illustrate the case
  , the right column the case
  . As explained in the main text in the case
  the duration of the
  signal diminishes causing the gene
  to be inhibited, while when
  the duration of
  increases causing an increase in the average value of
  . The response is different from the two-step regulation response because the presence of the direct branch limits the maximum duration of the expression of
  . The parameters
  (corresponding to
  ),
),  ,
,  ,
,  have been used for all the plots. For the left column
  ; for the right column
  .
.

