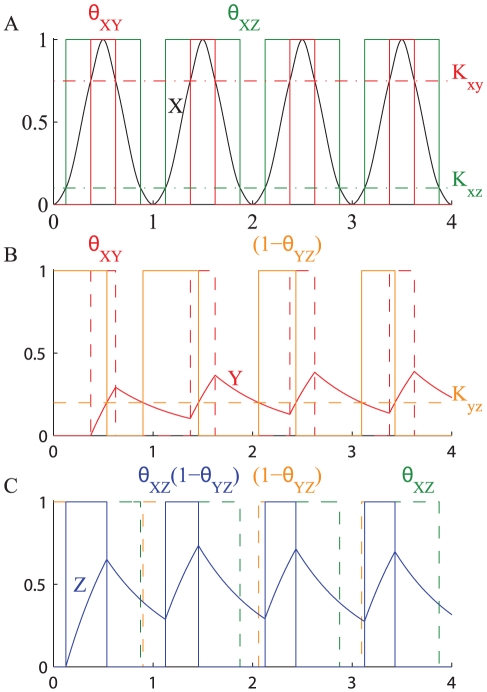
Figure 13. Oscillating transcription factor controlling the expression of gene  by means of an IFFL-1 with AND gate.
The plot shows the response of a gene expressed under the stimulus of an oscillating transcription factor  . The thresholds
  and
and  split the signal
  into the two digital signals
  and
and  (A).
(A).  controls the expression of
  (B). The digital signals
  and
and  are combined by the logic gate to finally control the expression of the gene
  (C). For the simulation the following parameters have been used:
  ,
,  ,
,  ,
,  ,
,  ,
,  ,
,  .
.

