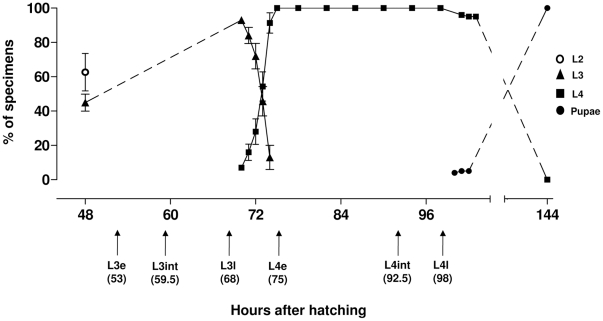
Figure 3. Period duration of Ae. aegypti larval ecdysis.
Symbols represent the cumulative percentage of specimens at different immature stages. Bars represent the standard deviation of three independent experiments. Arrows indicate the experimental points, defined in hours, as early (e), intermediate (int) and late (l) moments for each instar.

