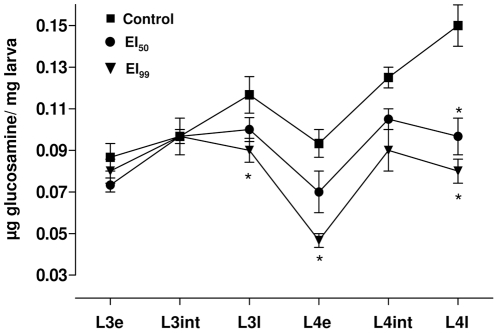
Figure 4. Effect of different novaluron concentrations on chitin production profile over Ae. aegypti L3 and L4 instars.
Experimental time points are indicated horizontally. Symbols refer to the average value and standard deviation of three independent experiments. Asterisks indicate significant differences when compared to the control condition at the same experimental time point (ANOVA, P<0.05). Each sample was collected on time points defined for the physiological instar development of the control group, according to Figure 3 (see section 4 of Methods).

