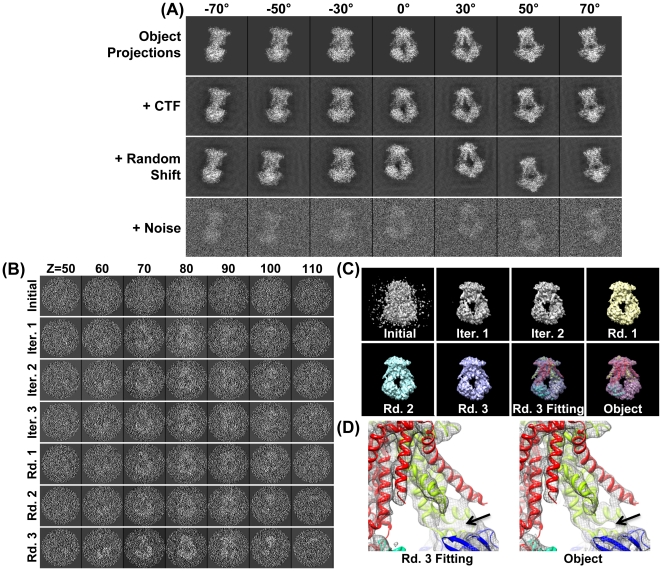
Figure 1. Simulating cryoET images and 3D reconstruction by IPET/FETR.
(A) An object, a 3D density map of a single-instance protein (molybdate, portion of PDB entry 2ONK) was projected into a total of 141 tilt series of 2D images by following the simulated cryoET tilt-angles (containing both tilt-axis and tilt-angle errors in a range of ±0.5°), in which seven projections were presented (first row); to simulate contrast transfer function (CTF), CTF at a defocus of 1.5 µm was applied to each image and then deconvoluted (second row); to simulate the translation errors, each image was randomly shifted with a maximal radius range of 30 pixels (third row); to simulate the noise, Gaussian noise (SNR = 0.2) was added to each image (last row). These images were used as the cryoET “raw” images for 3D reconstruction. (B) By FETR, the reference-free initial model was generated by directly back-projecting the “raw” images according to the measuring tilt-angles (containing immeasurable tilt-errors). The convergence of 3D reconstruction was approached by iterations through three major rounds. Selected ET slices of the 3D reconstruction of initial model, iteration one to three, round one to three, were displayed. (C) The isosurfaces of the corresponding 3D reconstructions were also displayed after they were low-pass filtered to 8 Å. The initial model displayed as a globular noisy blob, while the quality of reconstructions had been greatly improved after the 1–2 iterations. The reconstructions of each round contained many structural details, such as the α-helices. Docking the crystal structure into the isosurface from the final reconstruction displayed a near perfect match and no distinguishing differences from the object. (D) Zoom-in views of docked final reconstruction and object displayed slight difference as indicated by the arrows.

