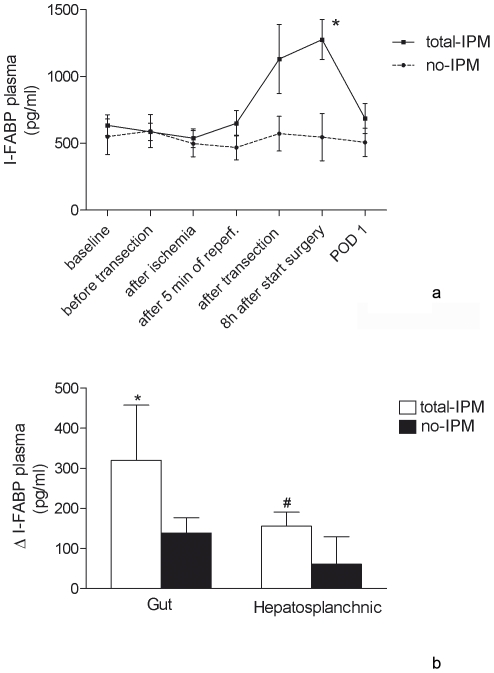
Figure 2. Time course of I-FABP plasma levels and interorgan arterio-venous concentration differences.
2A For visual purposes data were plotted as mean and SEM. * p<0.005 compared to baseline of total-IPM (T = 0), p<0.01 compared to no-IPM on T = 5. 2B Mean (SEM) arterio-venous concentration gradients of I-FABP across the gut (portal venous minus arterial) and the hepatosplanchnic area (hepatic venous minus arterial). I-FABP was specifically released from the gut (*p<0.0001 vs. zero) and this resulted in a net I-FABP release from the hepatosplanchnic area (# p<0.005 vs. zero).

