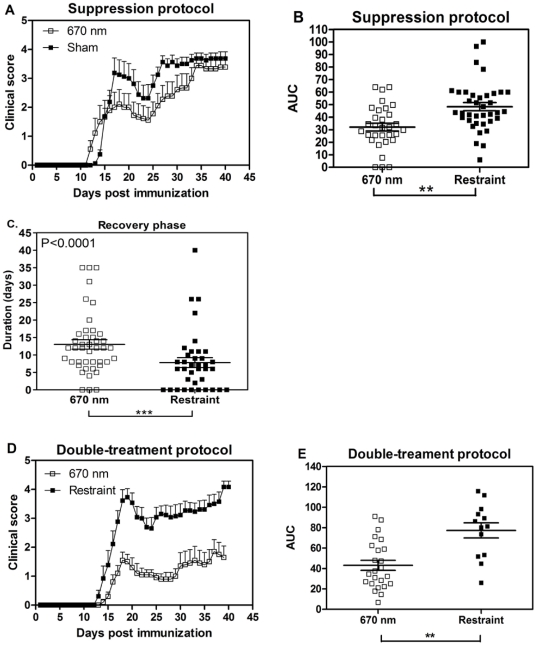
Figure 2. 670 nm light treatment reduces mean clinical score and signs of MOG-induced EAE.
EAE was induced with MOG35–55, and mice were treated with 670 nm light or no light (restraint) stress [sham]. (A) Mice treated with the suppression protocol. 670 nm light (-□-; n = 8) or sham (-▪-; n = 9). Representative 3 separate experiments with total n = 36 (670 nm light); n = 37 (sham). Error bars represent SEM. P<0.0001 by 2-way ANOVA. (B) Clinical course was plotted and the area under the curve (AUC) for all mice treated with the suppression protocol was determined and compared by 1-way ANOVA. Horizontal line: median value; Error bars: SEM. P<0.001. (C) duration of recovery for all mice treated with the suppression protocol was determined by counting the days of recovery from peak disease (decrease in 1 disease score) to the time of relapse (increase of 1 disease score); horizontal line: median value. (D) Mice were treated with 670 nm light (-□-; n = 10) or no light (restraint stress; -▪-; n = 7) using the double-treatment protocol. Representative of 3 separate experiments with a total n = 24 (670 nm) or 2 separate experiments n = 14 (restraint only-sham). Error bars represent SEM. P<0.0001 by 2-way ANOVA. (E) The AUC of clinical disease curves for all mice treated with the double treatment was determined; horizontal line: median value. Error bars: SEM; P = 0.0003 by 1-Way ANOVA. **P<0.01; ***P<0.001.

