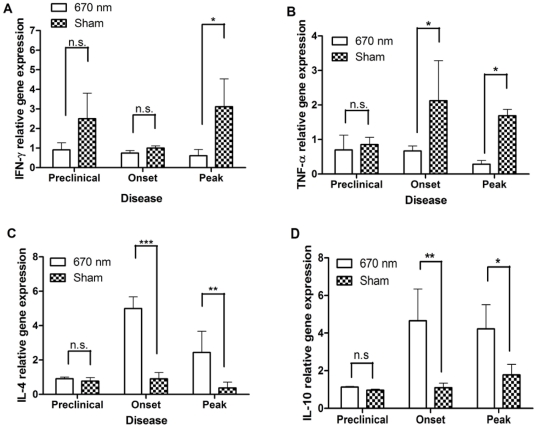
Figure 3. The suppression treatment protocol results in cytokine modulation within the CNS over the course of EAE.
Spinal cords (SC) were isolated from MOG35–55-immunized mice treated with the suppression protocol and QPCR was performed to quantify cytokine gene expression. Relative gene expression was determined by the Paffl method (2000) Gene expression was normalized at each disease stage with sham treated mice. (A) INF-γ; (B) TNF-α; (C) IL-4; (D) IL-10. n = 4 mice per group. Error bars indicated SD between 2 independent experiments. Data analyzed 2-way ANOVA. Multiple comparisons by Bonferroni post-test. *P<0.05, **P<0.01, ***P<0.0001, n.s = not significant.

